The browser you are using is not supported. Please consider using a modern browser.
Article
The Problem with Volume Metrics
 •
Jul 1, 2025
•
Jul 1, 2025
For years, volume has served as the default measure of officer performance in community banks. Loan production, deposit growth, accounts opened (remember Wells Fargo, folks?). These numbers are easy to quantify and quick to report. They’ve shaped compensation, fueled strategy, and filled board decks because they’re graspable on most levels.
But here’s the issue: volume doesn’t tell you what’s working. And in a margin-compressed, rate-sensitive environment, it’s not only an incomplete metric — it’s potentially a misleading one.
Why Volume Can’t Be the Entire Story
Picture this: two lenders each post $20 million in production. On paper, their contributions are equal. But one lender focused on price-sensitive real estate deals with thin spreads. The other booked a diverse portfolio of higher-yielding C&I loans with deeper relationships and stronger cross-sell potential.
Let’s take it a step further. Imagine two $5 million loans, both fully funded on the same day with the same 8.00% interest rate. One has a one-year maturity and is cash-secured. The other stretches ten years and is backed by non-owner-occupied commercial real estate. The first carries a lower FTP rate and lower credit risk. The second? Higher funding cost, higher risk, and a materially lower return.
Same rate. Same volume. Wildly different profit. Without visibility into risk ratings, amortization, FTP, and capital allocations, you’ll miss the story entirely.
This isn’t a niche scenario. As the Independent Community Bankers of America note in their 2025 CEO Outlook, lending remains the primary engine of bank profitability, but it’s also highly sensitive to pricing decisions and funding discipline. The activity may be back. But without the right insight, margin won’t be.
If You Know the Right Metrics, Why Aren’t You Using Them?
Most bankers can rattle off NIM. Many track loan yields by product. And most recognize that relationship depth matters more than headline deposit numbers.
So why aren’t these metrics driving day-to-day decisions?
Because they’re buried, outdated, or locked inside systems that weren’t built to connect the dots between performance and profitability.
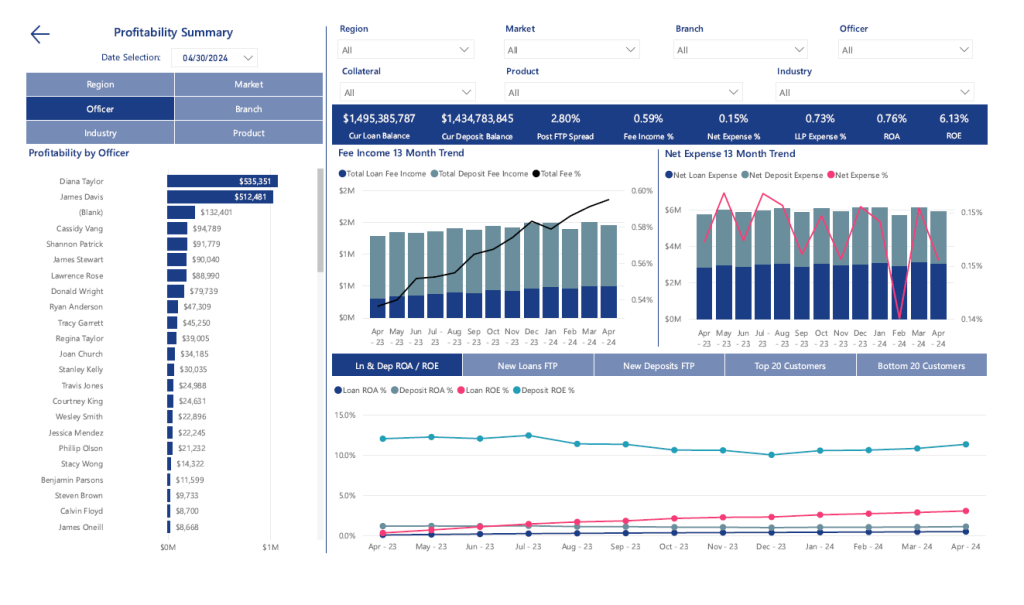
That’s the gap leading analytics tools, like KlariVis, are closing:
- Dashboards that show yield by officer, product, branch, and market
- Relationship-level insights that surface pricing power
- On demand funding comparisons that make pricing tradeoffs clear
You don’t need more data. You need to gain visibility into your existing data. When clarity around performance improves, coaching improves. And that’s when profitability follows.
Here’s the truth: when you finally give your team visibility into what actually drives return, they stop asking for exceptions and start asking better questions. Pricing conversations shift. Deposit retention efforts get smarter. And that constant battle between production and margin? It becomes a conversation, not a conflict.
Flipping the Script
One mid-sized community bank transitioned from fragmented, legacy reporting to profitability dashboards that connect frontline activity with actual return. Post-implementation of KlariVis, they:
- Increased loan yield targets by 50 basis points
- Equipped their lending team to coach with current pricing and funding insights
- Prioritized customer relationships that aligned with margin goals — not just those chasing rates
The shift wasn’t just analytical. It was cultural. Performance conversations moved from “what did you book?” to “what’s actually driving return?” This is where transformation really happens. When leaders stop asking “how much” and start asking “how well,” behavior shifts.
In one executive’s words: “Before, I could tell you what we booked. Now, I can tell you why it matters.” That’s the difference between reporting and insight.
Why Reporting Tools Need to Catch Up
Most reporting environments still reflect an outdated view of performance — one that rewards activity without fully surfacing impact. Traditional systems may provide raw numbers, but they rarely deliver the structured insight required to support forward-looking, risk-aware decisions.
To meaningfully improve margin, banks need tools that help them look beyond totals. Tools that bring loan pricing, funding costs, credit risk, and relationship value into a shared, accessible view. When these dimensions are visible — across departments, roles, and timelines — banks can stop relying on lagging indicators and start managing with precision.
Volume doesn’t fully and sustainably pay the bills. Margin does. In today’s market, producing more is not the same as producing smarter. The institutions that succeed next aren’t the ones that generate the most. They’re the ones that understand what to keep, what to let go, and how to price with purpose.
If you want to drive profitability, measure what actually shapes it. And then, dig in.